
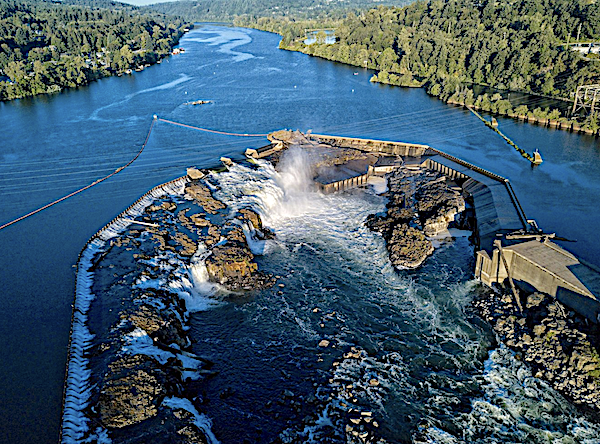
Once in orbit, the SWOT mission will regularly monitor not only mighty rivers like Oregon’s Willamette, pictured, but also smaller waterways that are at least 330 feet (100 meters) across.
Credit: U.S. Department of Energy

The ocean is an engine that drives Earth’s weather patterns and climate and sustains a substantial portion of life on the planet. A new animation based on data from two recently launched missions — NASA’s Plankton, Aerosol, Cloud, ocean Ecosystem (PACE) and the international Surface Water and Ocean Topography (SWOT) satellites — gives a peek into the heart of that engine.
Physical processes, including localized swirling water masses called eddies and the vertical movement of water, can drive nutrient availability in the ocean. In turn, those nutrients determine the location and concentration of tiny floating organisms known as phytoplankton that photosynthesize, converting sunlight into food. These organisms have not only contributed roughly half of Earth’s oxygen since the planet formed, but also support economically important fisheries and help draw carbon out of the atmosphere, locking it away in the deep sea.
“We see great opportunity to dramatically accelerate our scientific understanding of our oceans and the significant role they play in our Earth system,” said Karen St. Germain, director of the Earth Science Division at NASA Headquarters in Washington. “This visualization illustrates the potential we have when we begin to integrate measurements from our separate SWOT and PACE ocean missions. Each of those missions is significant on its own. But bringing their data together — the physics from SWOT and the biology from PACE — gives us an even better view of what’s happening in our oceans, how they are changing, and why.”
A collaboration between NASA and the French space agency CNES (Centre National d’Études Spatiales), the SWOT’ satellite launched in December 2022 to measure the height of nearly all water on Earth’s surface. It is providing one of the most detailed, comprehensive views yet of the planet’s ocean and its freshwater lakes, reservoirs, and rivers.
Launched in February 2024, NASA’s PACE satellite detects and measures the distribution of phytoplankton communities in the ocean. It also provides data on the size, amount, and type of tiny particles called aerosols in Earth’s atmosphere, as well as the height, thickness, and opacity of clouds.
“Integrating information across NASA’s Earth System Observatory and its pathfinder missions SWOT and PACE is an exciting new frontier in Earth science,” said Nadya Vinogradova Shiffer, program scientist for SWOT and the Integrated Earth System Observatory at NASA Headquarters.
Where Physics and Biology Meet
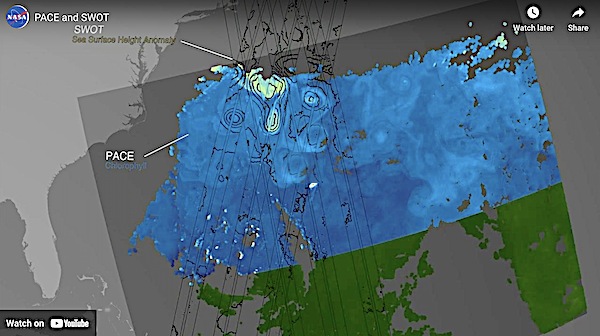
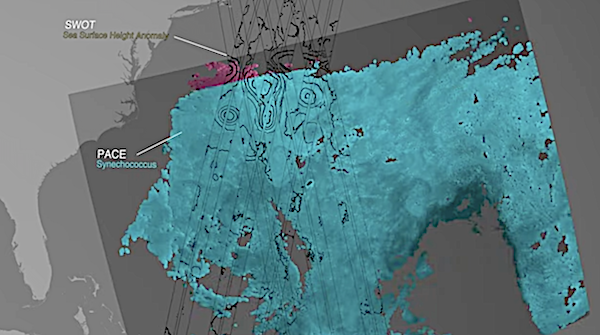
The animation above access here, starts by depicting the orbits of SWOT (orange) and PACE (light blue), then zooms into the North Atlantic Ocean. The first data to appear was acquired by PACE on Aug. 8. It reveals concentrations of chlorophyll-a, a vital pigment for photosynthesis in plants and phytoplankton. Light green and yellow indicate higher concentrations of chlorophyll-a, while blue signals lower concentrations.
Next is sea surface height data from SWOT, taken during several passes over the same region between Aug. 7 and 8. Dark blue represents heights that are lower than the mean sea surface height, while dark orange and red represent heights higher than the mean. The contour lines that remain once the color fades from the SWOT data indicate areas of the ocean with the same height, much like the lines on a topographic map indicate areas with the same elevation.
The underlying PACE data then cycles through several groups of phytoplankton, starting with picoeukaryotes. Lighter green indicates greater concentrations of this group. The final two groups are cyanobacteria — some of the smallest and most abundant phytoplankton in the ocean — called Prochlorococcus and Synechococcus. For Prochlorococcus, lighter raspberry colors represent higher concentrations. Lighter teal colors for Synechococcus signal greater amounts of the cyanobacteria.
The animation shows that higher phytoplankton concentrations on Aug. 8 tended to coincide with areas of lower water height. Eddies that spin counterclockwise in the Northern Hemisphere tend to draw water away from their center. This results in relatively lower sea surface heights in the center that draw up cooler, nutrient-rich water from the deep ocean. These nutrients act like fertilizer, which can boost phytoplankton growth in sunlit waters at the surface.
Overlapping SWOT and PACE data enables a better understanding of the connections between ocean dynamics and aquatic ecosystems, which can help improve the management of resources such as fisheries, since phytoplankton form the base of most food chains in the sea. Integrating these kinds of datasets also helps to improve calculations of how much carbon is exchanged between the atmosphere and the ocean. This, in turn, can indicate whether regions of the ocean that absorb excess atmospheric carbon are changing.